Popularity
2.8
Stable
Activity
0.0
Stable
85
8
37
Code Quality Rank:
L4
Programming language: Java
License: GNU General Public License v3.0 only
Tags:
Chart
NumAndroidCharts alternatives and similar packages
Based on the "Chart" category.
Alternatively, view NumAndroidCharts alternatives based on common mentions on social networks and blogs.
-
MPAndroidChart
A powerful 🚀 Android chart view / graph view library, supporting line- bar- pie- radar- bubble- and candlestick charts as well as scaling, panning and animations. -
HelloCharts
Charts library for Android compatible with API 8+, several chart types with scaling, scrolling and animations 📊 -
WilliamChart
Android Library to rapidly develop attractive and insightful charts in android applications. -
Android-Charts
Open-source native Android graph/chart framework includes line chart,stick chart,candlestick chart,pie chart,spider-web chart etc. -
achartengine
Charting library for Android applications. Automatically exported from code.google.com/p/achartengine -
SciTrader - Android Financial Charts
Finance.Android aka the 'SciTrader SDK' is a free open source financial stock chart, cryptocurrency chart, trading chart library built on top of SciChart's Android Chart Library
WorkOS - The modern identity platform for B2B SaaS
The APIs are flexible and easy-to-use, supporting authentication, user identity, and complex enterprise features like SSO and SCIM provisioning.
Promo
workos.com

* Code Quality Rankings and insights are calculated and provided by Lumnify.
They vary from L1 to L5 with "L5" being the highest.
Do you think we are missing an alternative of NumAndroidCharts or a related project?
README
numAndroidCharts
A Powerful Android Charting Library by Numetric Technologies
Features
Core features:
- Line Chart
- Bar Chart
- Scatter Chart
- Bubble Chart
- Pie Chart
- Donut Chart
- Radar Chart
- Candle Stick Chart
- Grouped Bar Chart
- Multi-Series Bubble Chart
- Multi-Series Line Chart
- Area Chart
- Multi-Series Scatter Chart
- Combined Line and Bar Chart
- Semi Circle Pie Chart
- Multi-Series Spline Chart
- Spline Chart
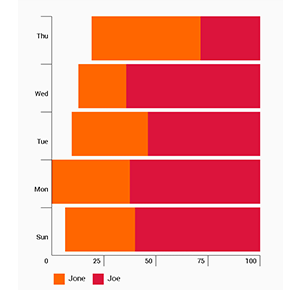
- Horizontal Bar Chart
- Pyramid Chart
- Funnel Chart
- Stacked Bar Chart
- Column Range Chart
- Stacked Percentage Column Chart
- Horizontal Stacked Bar Chart
- Horizontal Stacked Percentage Bar Chart
- Combined Spline and Bar Chart
- Spline Area Chart
- Combined Line and Area Chart
- Combined Column, Line and Area Chart
- Stacked Area Chart
- Water Fall Chart
- Line Chart with TrendLines
- Line Chart with Trendzone
- Bar Chart with TrendLines
- Bar Chart with Trendzone
- Gauge Chart
- Multi Level Pie Chart
- Step Line Chart
- Multi-Series Step Line Chart
- Step Area Chart
- Heat Map
- Bar Chart with Inverse Y-Axis
- Line Chart with Inverse Y-Axis
- Scatter Chart with Inverse Y-Axis
- Logarithmic Line Chart
- Logarithmic Multi-Series Line Chart
- Logarithmic Bar Chart
- Horizontal Range Stacked Bar Chart
- Percentage Range Stacked Column Chart
- Horizontal Percentage Range Bar Chart
Tutorials:
- Line Chart
- Bar Chart
- Scatter Chart
- Bubble Chart
- Pie Chart
- Donut Chart
- Radar Chart
- Candle Stick Chart
- Grouped Bar Chart
- Multi-Series Bubble Chart
- Multi-series Line Chart
- Area Chart
- Multi-Series Scatter Chart
- Combined Line and Bar Chart
- Semi Circle Pie Chart
- Multi-Series Spline Chart
- Spline Chart
- Horizontal Bar Chart
- Pyramid Chart
- Funnel Chart
- Stacked Bar Chart
- Column Range Chart
- Stacked Percentage Column Chart
- Horizontal Stacked Bar Chart
- Horizontal Stacked Percentage Bar Chart
- Combined Spline and Bar Chart
- Spline Area Chart
- Combined Line and Area Chart
- Combined Column, Line and Area Chart
- Stacked Area Chart
- Water Fall Chart
- Line Chart with TrendLines
- Line Chart with Trendzone
- Bar Chart with TrendLines
- Bar Chart with Trendzone
- Gauge Chart
- Multi Level Pie Chart
- Step Line Chart
- Multi-Series Step Line Chart
- Step Area Chart
- Heat Map
- Bar Chart with Inverse Y-Axis
- Line Chart with Inverse Y-Axis
- Scatter Chart with Inverse Y-Axis
- Logarithmic Line Chart
- Logarithmic Multi-Series Line Chart
- Logarithmic Bar Chart
- Horizontal Range Stacked Bar Chart
- Percentage Range Stacked Column Chart
- Horizontal Percentage Range Bar Chart
Chart types:
- Line Chart (simple design)

- Bar Chart (simple design)

- Scatter Chart (simple design)

- Bubble Chart

- Pie Chart (Simple)

- Donut Chart (Simple)

- Radar Chart (Simple)

- Candle Stick Chart
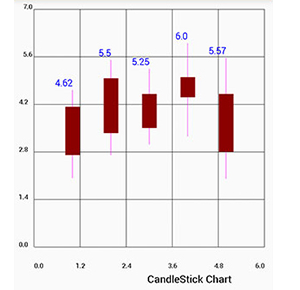
- Grouped Bar Chart

- Multi-Series Bubble Chart
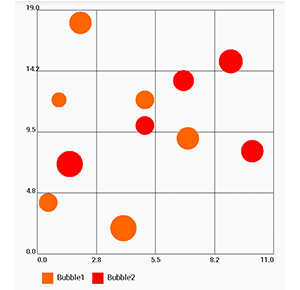
- Multi-Series Line Chart
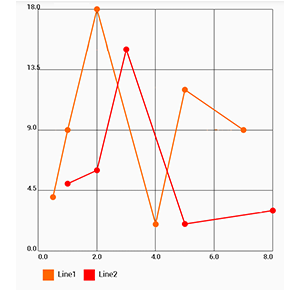
- Area Chart

- Multi-Series Scatter Chart
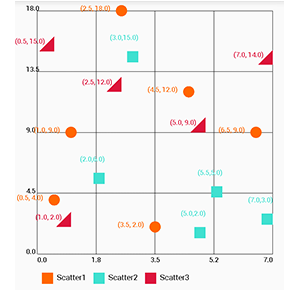
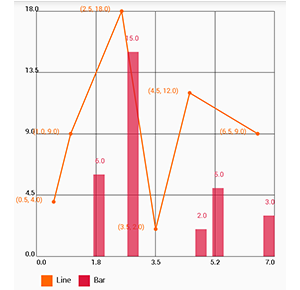
- Combined Line and Bar Chart
- Semi Circle Pie Chart

- Multi-Series Spline Chart
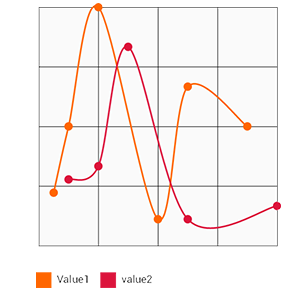
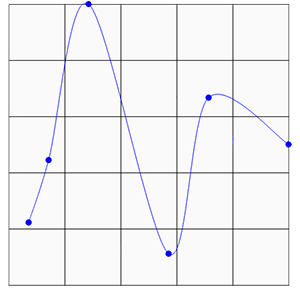
- Spline Chart
- Horizontal Bar Chart
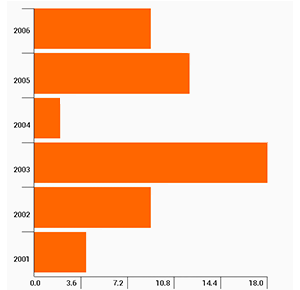
- Pyramid Chart
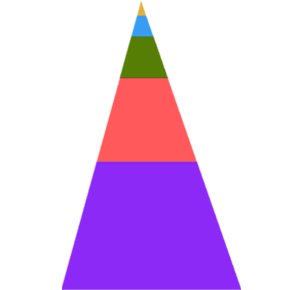
- Funnel Chart

- Stacked Bar Chart

- Column Range Chart
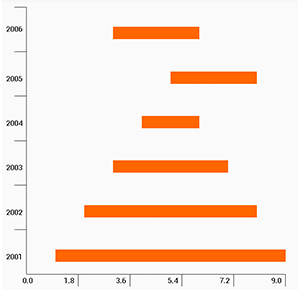
- Stacked Percentage Column Chart

- Horizontal Stacked Bar Chart
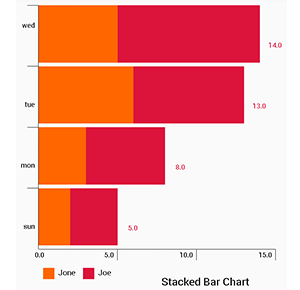
- Horizontal Stacked Percentage Bar Chart

- Combined Spline and Bar Chart
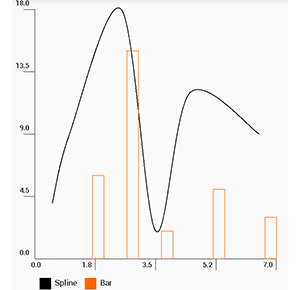
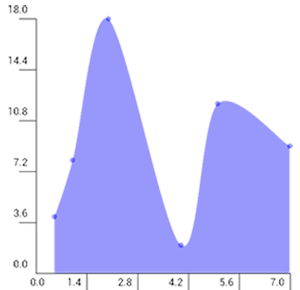
- Spline Area Chart
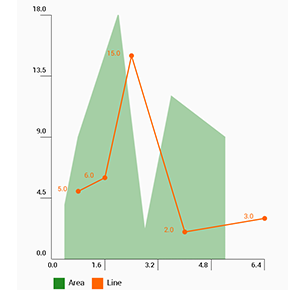
- Combined Line and Area Chart
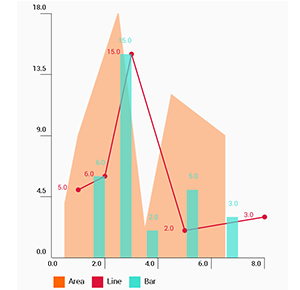
- Combined Column, Line and Area Chart
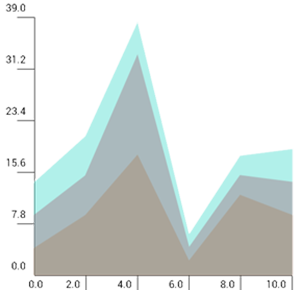
- Stacked Area Chart
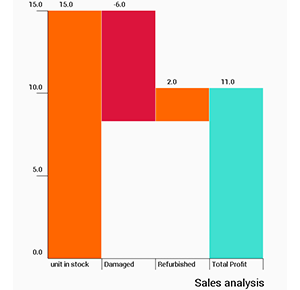
- Water Fall Chart
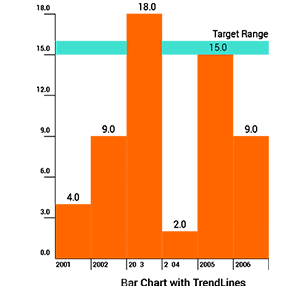
- Line Chart with TrendLines

- Line Chart with Trendzone

- Bar Chart with TrendLines

- Bar Chart with Trendzone
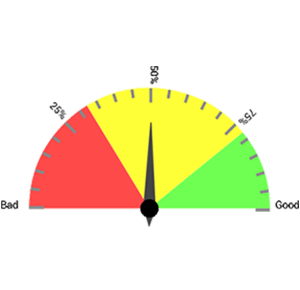
- Gauge Chart
- Multi Level Pie Chart

- Step Line Chart

- Multi-Series Step Line Chart

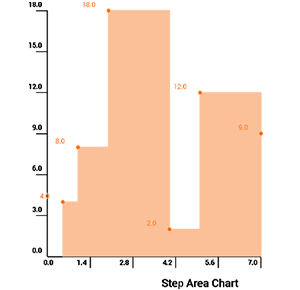
- Step Area Chart
- Heat Map

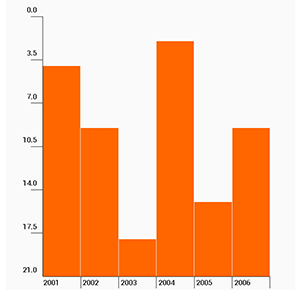
- Bar Chart with Inverse Y-Axis
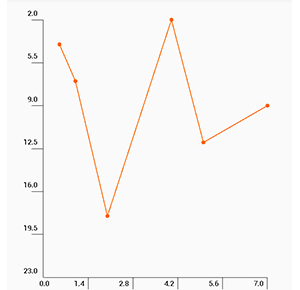
- Line Chart with Inverse Y-Axis
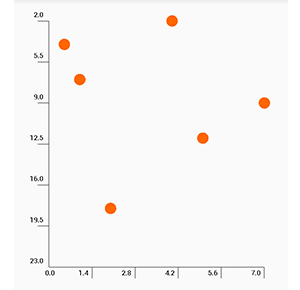
- Scatter Chart with Inverse Y-Axis
- Logarithmic Line Chart
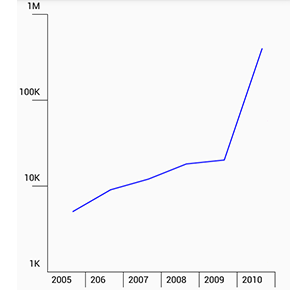
- Logarithmic Multi-Series Line Chart
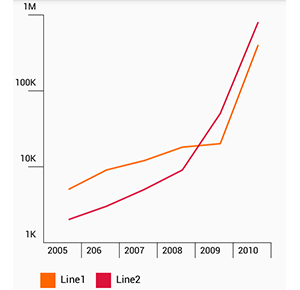
- Logarithmic Bar Chart
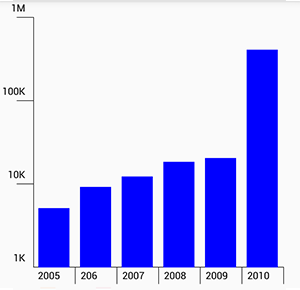
- Horizontal Range Stacked Bar Chart
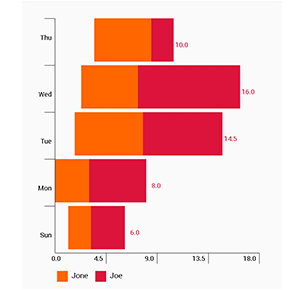
- Percentage Range Stacked Column Chart
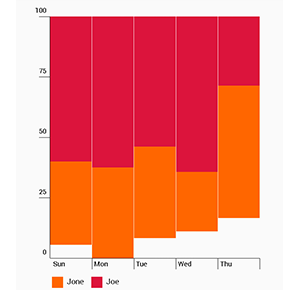
- Horizontal Percentage Range Bar Chart
